The short answer
- A fair value gap formed on about 19 of every 100 candles: 161,538 gaps in 855,943 candles across BTC, ETH, SOL, EUR/USD, Nasdaq 100 futures and S&P 500 futures.
- On the 1-hour chart, 77% of gaps were tapped within 10 candles, 70% reached their 50% midpoint and 63% were filled completely. Within 200 candles, 91% were filled.
- The typical gap fills fast. The median hourly gap was tapped 2 candles after it formed and filled after 4.
- Not every gap fills: 5.9% of hourly gaps were still open 500 candles later.
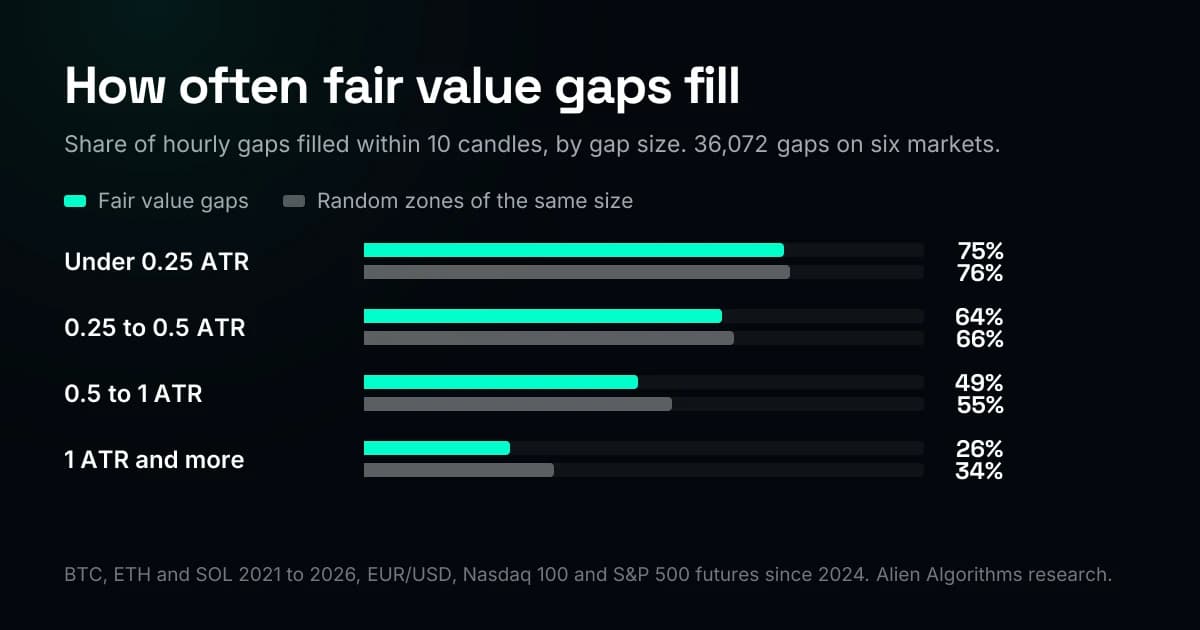
- Size changes the picture. Gaps of 1 ATR or more, 9% of all gaps, were filled within 10 candles 26% of the time, against 75% for gaps under 0.25 ATR.
- Zones of the same size placed at random filled at about the same rate as small gaps. Large gaps were filled less often than their random zones: 26% against 34% within 10 candles.
- The results barely change between markets, between timeframes from 15 minutes to 1 day, or between bullish and bearish gaps.
How we measured
We used the definition from our fair value gap guide, on candle wicks, with no minimum size:
- Bullish gap: the third candle’s low is above the first candle’s high. The gap runs from the first candle’s high (its bottom) to the third candle’s low (its top).
- Bearish gap: the third candle’s high is below the first candle’s low. The gap runs from the third candle’s high to the first candle’s low.
- Only three consecutive candles count. A gap across a session break, a weekend or missing data is skipped.
For every gap we recorded the first candle that tapped it (traded into it), reached its 50% midpoint, filled it (traded to its far edge) and closed through it (closed beyond its far edge), counting from the candle after the third. A rate within N candles only counts gaps with at least N candles of data after them, so the gaps of the last few weeks do not pull it down.
Gap size is measured in ATR: the height of the gap divided by the 14-candle Average True Range at the third candle. That makes a gap on BTC and a gap on EUR/USD comparable.
| Market | Data | Period | Timeframes |
|---|---|---|---|
| BTC (Binance perpetual) | Binance USDT perpetual, 15-minute candles | 2021-01-01 to 2026-10-31 | 15m, 1h, 4h, 1D |
| ETH (Binance perpetual) | Binance USDT perpetual, 15-minute candles | 2021-01-01 to 2026-10-31 | 15m, 1h, 4h, 1D |
| SOL (Binance perpetual) | Binance USDT perpetual, 15-minute candles | 2021-01-01 to 2026-10-31 | 15m, 1h, 4h, 1D |
| EUR/USD | Yahoo Finance, hourly | 2024-01-22 to 2026-10-30 | 1h |
| Nasdaq 100 futures (NQ) | Yahoo Finance, continuous front month, hourly | 2024-06-17 to 2026-10-30 | 1h |
| S&P 500 futures (ES) | Yahoo Finance, continuous front month, hourly | 2024-06-17 to 2026-10-30 | 1h |
A high fill rate on its own proves little, because price wanders back over most recent ranges. So each gap got a control: a zone of the same direction and the same size in ATR, placed against a random candle that did not complete a gap, exactly where a gap would sit. For a bullish zone its top is that candle’s low. Gaps and controls were measured by the same code.
How fast gaps fill
Hourly gaps reached within 10 candles
- Tapped77.4%
- Reached the midpoint69.8%
- Filled63.3%
- Closed through49.6%
Most of what happens to a gap happens in the next few candles. The median hourly gap was tapped after 2 candles, reached its midpoint after 3 and was filled after 4. After that the rates climb slowly: 83% filled within 50 candles, 91% within 200 and 94% within 500.
The timeframe hardly matters. Counted in candles of their own timeframe, gaps on the 15-minute chart and on the daily chart fill at almost the same pace:
| Timeframe | Gaps | Filled within 10 candles | Within 50 | Within 200 | Median candles to fill |
|---|---|---|---|---|---|
| 15m | 117,221 | 64.5% | 83.4% | 91.5% | 4 |
| 1h | 27,194 | 63.3% | 82.3% | 90.7% | 4 |
| 4h | 7,003 | 62.2% | 81.0% | 89.4% | 4 |
| 1D | 1,242 | 60.2% | 78.0% | 87.4% | 5 |
The same on every market
Crypto, a currency pair and two index futures gave nearly identical numbers. On the hourly chart, the share filled within 10 candles ranged from 62% to 65%.
| Market | Gaps | Tapped within 10 candles | Filled within 10 | Filled within 200 | Median candles to fill |
|---|---|---|---|---|---|
| BTC (Binance perpetual) | 8,776 | 77.3% | 63.7% | 91.2% | 4 |
| ETH (Binance perpetual) | 8,955 | 78.0% | 63.6% | 90.6% | 4 |
| SOL (Binance perpetual) | 9,463 | 76.6% | 62.7% | 90.4% | 4 |
| EUR/USD | 3,615 | 78.4% | 61.8% | 91.4% | 5 |
| Nasdaq 100 futures (NQ) | 2,653 | 77.6% | 63.6% | 92.1% | 5 |
| S&P 500 futures (ES) | 2,610 | 77.1% | 64.7% | 93.1% | 5 |
Bullish and bearish gaps behaved the same way too: 63.6% and 63.0% filled within 10 candles.
Large gaps stay open longer
Hourly gaps filled within 10 candles, by size
- Under 0.25 ATR49% of gaps75.1%
- 0.25 to 0.5 ATR25% of gaps63.9%
- 0.5 to 1 ATR18% of gaps49.0%
- 1 ATR and more9% of gaps25.5%
About half of all gaps are smaller than a quarter of an ATR. These are the gaps a lower-timeframe chart prints many times a day, and they close almost at once: the median one was filled after 2 candles. A gap of 1 ATR or more took a median of 22 candles, and 15.5% of them were still open 500 candles later.
| Gap size | Share of gaps | Filled within 10 candles | Within 50 | Within 200 | Median candles to fill |
|---|---|---|---|---|---|
| Under 0.25 ATR | 48.6% | 75.1% | 88.8% | 94.6% | 2 |
| 0.25 to 0.5 ATR | 24.6% | 63.9% | 83.6% | 91.3% | 5 |
| 0.5 to 1 ATR | 18.1% | 49.0% | 76.0% | 87.9% | 9 |
| 1 ATR and more | 8.7% | 25.5% | 58.2% | 77.3% | 22 |
Real gaps against random zones
A high fill rate sounds like proof that price comes back to fill imbalances. The control zones say that for most gaps it is simply how price moves: a small range just behind price gets revisited whether or not it is a gap.
| Gap size | Gaps filled within 10 candles | Control zones filled | Gaps tapped within 10 candles | Control zones tapped |
|---|---|---|---|---|
| All sizes | 63.3% | 65.9% | 77.4% | 80.1% |
| Under 0.25 ATR | 75.1% | 75.5% | 79.8% | 80.0% |
| 0.25 to 0.5 ATR | 63.9% | 66.4% | 78.1% | 80.2% |
| 0.5 to 1 ATR | 49.0% | 54.8% | 74.7% | 80.1% |
| 1 ATR and more | 25.5% | 33.7% | 67.7% | 80.3% |
The difference is in the large gaps. Price came back to them less often than to random zones of the same size, and later: within 10 candles, 68% were even tapped, against 80% of their control zones. A large gap marks a move that tends to keep going, which is what traders mean by displacement. It held on every timeframe:
| Timeframe | Gaps | Gaps filled | Control zones filled |
|---|---|---|---|
| 15m | 7,383 | 28.0% | 33.1% |
| 1h | 3,143 | 25.5% | 33.7% |
| 4h | 687 | 28.5% | 35.7% |
| 1D | 94 | 20.2% | 30.9% |
The first return tells the same story. When price first came back into a gap, it closed back out the way it came, before closing through, 67% of the time. Control zones did that 66% of the time. A tap into a gap is not, on its own, a reason to expect a bounce.
What this means on a chart
- Expect small gaps to fill. A gap under a quarter of an ATR fills like any small range near price, so its fill is not a signal either way. A minimum gap size, which most fair value gap indicators offer, removes most of them.
- Treat a large gap as a sign of displacement. Price comes back to it less often and later than chance, so waiting for a large gap to fill often means watching the move leave without you.
- Read the closes, not the tap. A first touch closes back out about two times in three whether or not the zone is a gap. A close beyond the far edge is what undoes a gap.
This is why the Institutional Imbalance Framework weighs every gap by the move that created it: its CVMI line counts a fast, thinly traded gap for more than a broadly supported one, and its SOMM labels show how much of the gaps inside an order block has really been filled. To mark gaps by hand and decide which ones to keep, start with our fair value gap guide.
Limits of this study
- It measures how price returns to gaps, not whether trading them makes money. There are no entries, stops, fees or slippage in it.
- Crypto covers 2021 to October 2026 on Binance perpetuals. EUR/USD and the index futures cover about two and a half years of hourly data from Yahoo Finance. The futures are continuous front-month contracts, so the few roll dates can add a jump.
- Gaps are found on wicks by the standard three-candle rule, with no minimum size. An indicator with a minimum size, or a rule based on candle bodies, finds fewer gaps.
- Horizons are counted in candles of the gap’s own timeframe: 10 candles is 2.5 hours on the 15-minute chart and 10 days on the daily chart.
- Higher timeframes are built from 15-minute candles on UTC boundaries, so a daily candle runs from 00:00 to 24:00 UTC, as on Binance.
- The daily chart has only 94 large gaps, so read that row as a direction rather than a precise figure.
Use the data
Every table on this page is in one file: fvg-fill-study.csv. You are free to reuse the numbers and the charts, with a link to this page, under the CC BY 4.0 licence.
Questions
Do all fair value gaps get filled?
No. In our data, 5.9% of hourly gaps were still not filled 500 candles after they formed, and 15.5% of gaps of 1 ATR or more. Most small gaps do fill, but so do random price ranges of the same size.
How long does it take a fair value gap to fill?
The median hourly gap was filled 4 candles after it formed, and 63% filled within 10 candles. Large gaps take longer: a median of 22 candles for gaps of 1 ATR or more.
What percentage of fair value gaps get filled?
On 1-hour charts across six markets, 63% within 10 candles, 83% within 50 and 91% within 200. On 15-minute, 4-hour and daily charts the rates are within a few points of those.
Do fair value gaps act as support and resistance?
Not by themselves in our data. When price first came back into a gap, it closed back out the way it came 67% of the time, but random zones of the same size did that 66% of the time. What sets gaps apart is size: price comes back to large gaps less often.
Which fair value gaps are most likely to stay open?
Large ones. Gaps of 1 ATR or more were filled within 10 candles 26% of the time, against 75% for gaps under 0.25 ATR, and less often than random zones of the same size (34%).