
PineCanvas Open-source graphics engine for Pine Script v6High-definition graphics on TradingView charts
PineCanvas is an open-source graphics engine for TradingView, published as a Pine Script v6 library. It draws heatmaps, detailed images, 3D frames and tens of thousands of filled shapes by packing same-colour regions into shared drawings, so one chart can hold over a million cells.
See the code examplesThe black hole is the library's cover scene, written in Pine Script and drawn with PineCanvas. Here the same maths runs in your browser, with the disk set turning and the sky following your pointer.
Boundaries instead of cells
Pine Script allows 500 boxes and 100 polylines per indicator. One box per cell uses up the box budget at just 20 × 25 cells.
PineCanvas breaks that one-cell, one-drawing relationship. It traces each same-colour region, discards the internal edges, and joins separate islands through invisible, zero-width links. A solid block of thousands of cells is represented by its four outer corners. Holes and empty space stay unfilled.
Raise the sample's resolution belowon the right. The boxes pass the limit quickly; the polylines do not move.
The dashed lines are the links that join one colour's separate regions into a single polyline. They are shown here; on a chart they enclose no area and draw nothing.
Over one million cells in one image
Each cell acts like a pixel in the source image. Around 1.1 million cells is an attainable scale, not a theoretical maximum: transparent cells add no geometry, and same-colour regions share drawings.
The practical limit depends on boundary complexity, colour distribution, memory and execution time, not a fixed pixel count. Smooth or sparse images can go higher; highly fragmented ones can be demanding at much smaller sizes.
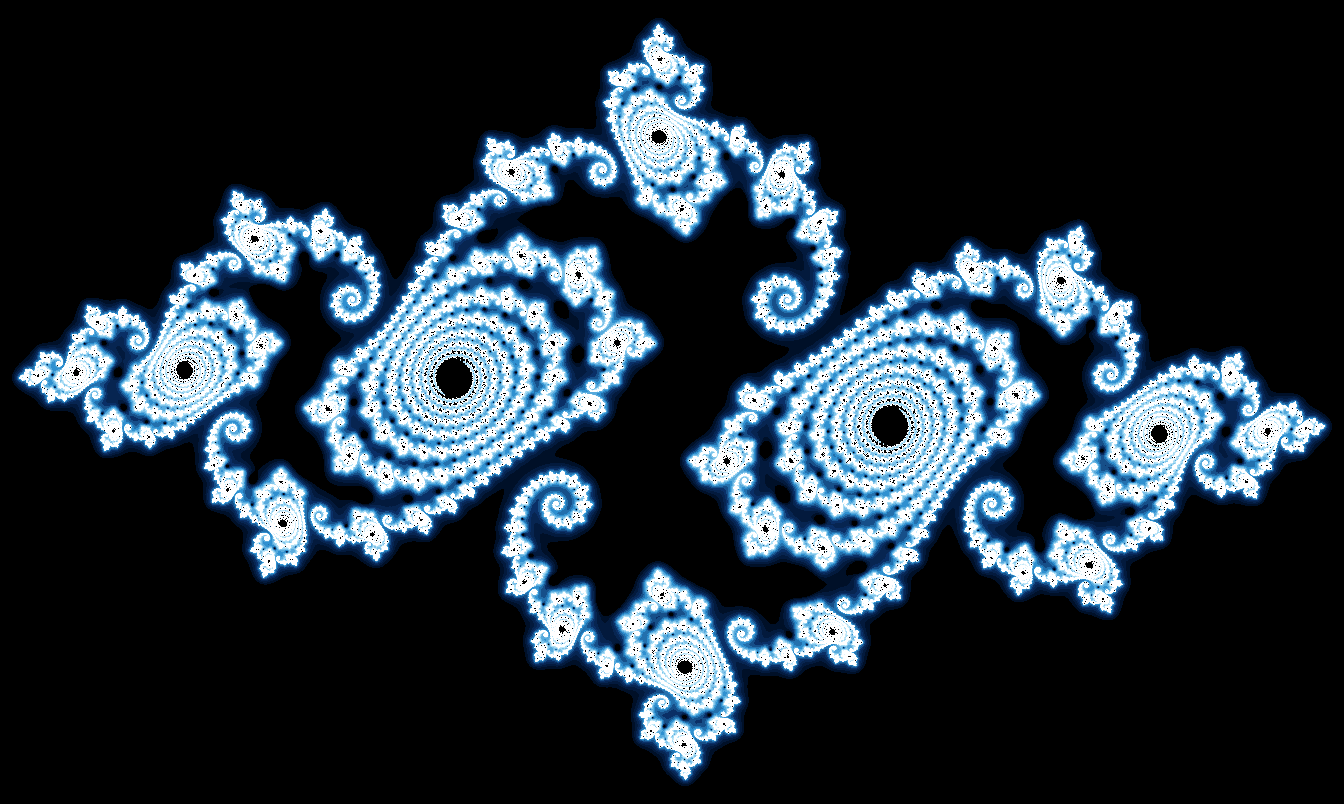
On the chart it looks like this. The published fractal is 1344 × 804 cells, or 1,080,576 individually addressable cells, pushed through thin branches, isolated islands and several colours. Its calculation is spread across historical bars and the final image is rendered in sections to manage the heavier workload.
Heatmaps placed directly on price
A heatmap puts numbers across time and price, turning levels and changes into visible bands over the candles.
The model belongs to your indicator. Its values go into a ValueField; PineCanvas maps their intensity to colour and places the result at real price levels. colorLevels() picks 2 to 100 gradient levels, opacity() sets how visible weak and strong values are, and gamma() controls how strongly the weaker ones show.
When one new column arrives each bar, ValueScroll and PaletteScroll keep a moving window. They overwrite the oldest column instead of shifting the whole history.
Read the heatmap guide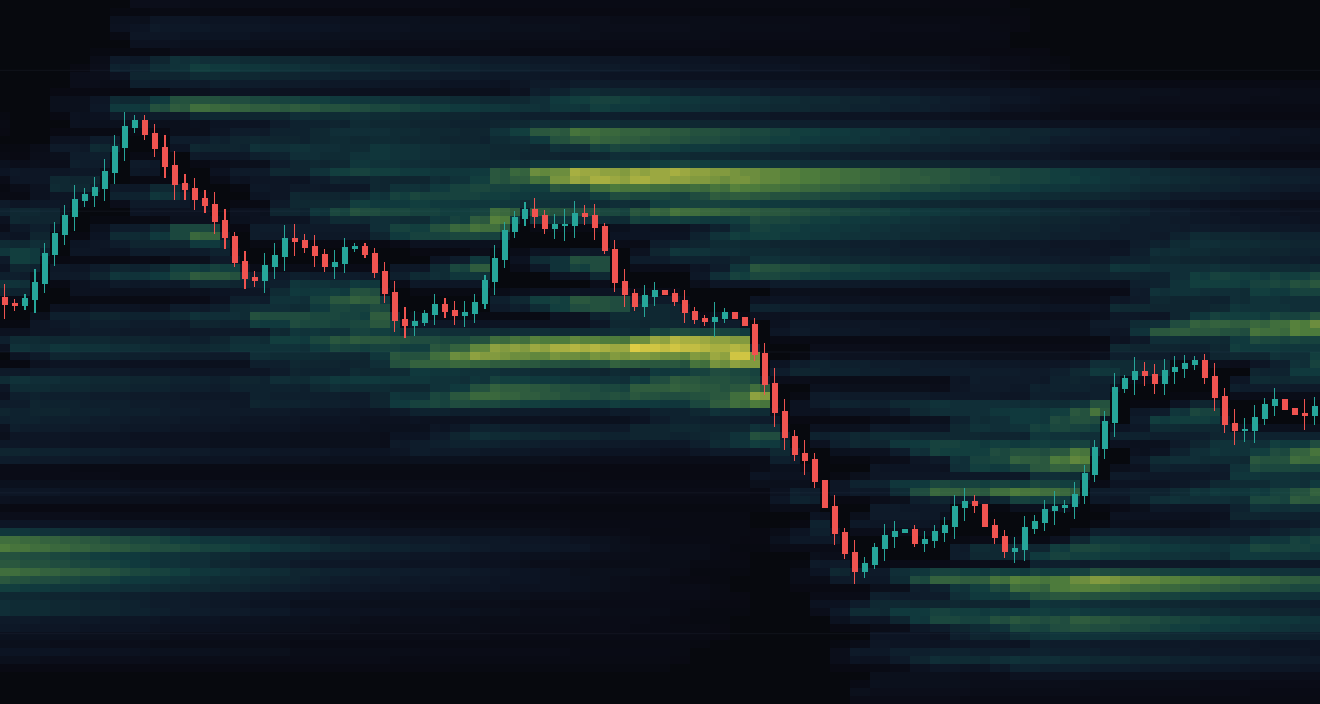
var pc.Canvas heat = pc.heatmap()
  .colorLevels(48)
  .opacity(10, 90)
  .gamma(0.70)
The published liquidation heatmap models leveraged exposure from price and volume, spreads it across leverage levels, fades older positions and removes a level once price crosses it. Brighter bands show where the estimated exposure remains concentrated. The same approach suits volatility maps, order-flow estimates and probability surfaces.
Our open-source Liquidation Heatmap indicator is drawn with PineCanvas. It estimates liquidation levels from Open Interest changes and groups them into price zones.
See the Liquidation HeatmapWhat it draws on a real chart
Four captures from TradingView, each drawn natively by a Pine Script that imports PineCanvas. Hover to magnify, click to open full size.Tap one to open it full size.
Pine3D scenes as high-definition images
Pine3D builds the meshes, the camera and the lighting. Its rasterize() call writes the finished frame straight into a PaletteField, and PineCanvas turns that into chart drawings. This scene is 1536 × 960 cells, with depth-tested visibility, smooth shading and cast shadows.
- One call connects the two libraries
- Larger frames are split across storage bands
- Shading arrives as an exact palette
Filled shapes by the thousand
Not everything belongs in a grid. The Shape API queues rectangles, triangles, ellipses and custom polygons in chart time and price, then packs every shape of one colour into shared polylines. This session profile keeps its newest 24,000 rectangles on screen, coloured by value area and point of control.
- About 1,600 four-corner rectangles fit in one polyline
- A batch accepts up to 100,000 source vertices
- Fewer distinct colours leave room for more shapes
Whole interfaces around the candles
The same filled geometry can build an interface. This Astro HUD is a zodiac wheel, a band aligned with chart time and an ephemeris panel, assembled from rings, sectors, curved panels and glow layers through rect() and poly(). Its layout is calculated from the visible bars and price range, so it refits as the chart is panned or zoomed.
- Thousands of shapes form one translucent overlay
- Ordinary Pine labels supply text and glyphs
- Shapes stay anchored to real times and prices
Exact colours, full pictures
A PaletteField is not limited to a few market-state colours. Every cell selects an exact palette entry, so a script can draw detailed scenes with precise edges, fine shading and transparent areas. The script generates the picture; PineCanvas handles its palette, its filled contours and its placement on the chart.
- Palette index -1 leaves a cell transparent
- row() and band() write whole rows without a call per cell
- Unchanged frames reuse cached contour work
Complete Pine Script examples you can paste
Each of these is a whole indicator. Add it to a chart, then change it. The docs quickstart explains the first two.
A PaletteField holds colour indices in a grid. Give it a palette, assign values to its cells, and draw. This colours the last 30 candles by direction.
Quick start: Candle_Colours.pine
//@version=6
indicator("PineCanvas - Candle Colours", overlay = false, max_polylines_count = 100)
import Alien_Algorithms/PineCanvas/1 as pc
// Make sure to update to the latest library version

var pc.PaletteField pixels = pc.paletteField(2, 30)
var pc.Canvas canvas = pc.newCanvas(array.from(color.red, color.lime))

if barstate.islast and bar_index >= 29
    for col = 0 to 29
        pixels.set(0, col, close[29 - col] >= open[29 - col] ? 1 : 0)
    canvas.drawLookback(pixels, 0, 0.0, 2.0)
Rolling heatmap: Rolling_RSI_Heatmap.pine
//@version=6
indicator("PineCanvas - Rolling RSI Heatmap", overlay = false,
  max_polylines_count = 100)
import Alien_Algorithms/PineCanvas/1 as pc
// Make sure to update to the latest library version

// Stateful series calculations must run on every bar.
float rsi5 = ta.rsi(close, 5)
float rsi8 = ta.rsi(close, 8)
float rsi13 = ta.rsi(close, 13)
float rsi21 = ta.rsi(close, 21)
float rsi34 = ta.rsi(close, 34)

var pc.ValueScroll history = pc.valueScroll(5, 150)
var pc.Canvas heat = pc.heatmap(
  pc.gradient(#602060, #305bb4, #31b6ad, #f4d24c, #f07735))
  .colorLevels(32)
  .valueRange(0.0, 100.0)
  .opacity(25, 100)

if barstate.isconfirmed
    history.push(array.from(rsi5, rsi8, rsi13, rsi21, rsi34))

if barstate.islast
    heat.drawLookback(history, 0.0, 5.0)
Pine3D frame: Pine3D_with_PineCanvas.pine
//@version=6
indicator("Pine3D with PineCanvas", overlay = false, max_polylines_count = 100)
import Alien_Algorithms/Pine3D/5 as p3d
import Alien_Algorithms/PineCanvas/1 as pc
// Make sure to update to the latest library version

var p3d.Scene scene = p3d.newScene()
var pc.PaletteField frame = pc.paletteField(240, 384)
var pc.Canvas canvas = pc.newCanvas()

if barstate.isfirst
    scene.add(p3d.cube(60.0, color.orange))
    // The floor: grid() faces down, so it is turned over
    scene.add(p3d.grid(600.0, 600.0, 8, 8, #3a4258).rotateTo(180.0, 0.0, 0.0).moveTo(0.0, -30.0, 0.0))
    scene.camera.orbit(35.0, 25.0, 180.0)
    scene.setLightDir(-0.7, -1.0, -0.3).setAmbient(0.25).setShadowStrength(0.6)

if barstate.islastconfirmedhistory and bar_index >= 384
    array<color> shades = scene.rasterize(frame.band(0), 384, 240, shades = 16, zoom = 2.4)
    canvas.palette(shades)
    canvas.drawLookback(frame, 0, 0.0, 240.0)
Filled shapes: High_Volume_Zones.pine
//@version=6
indicator("PineCanvas - High Volume Zones", overlay = true,
  max_polylines_count = 100)
import Alien_Algorithms/PineCanvas/1 as pc
// Make sure to update to the latest library version

int lookback = input.int(100, "Lookback bars", minval = 20, maxval = 300)
float averageVolume = ta.sma(volume, 20)
var pc.Canvas zones = pc.newCanvas()

if barstate.islast and bar_index >= lookback + 19
    for column = 0 to lookback - 1
        int offset = lookback - 1 - column
        int leftTime = time[offset]
        int rightTime = offset > 0 ? time[offset - 1] : time + int(time - time[1])
        // Heavier volume draws more opaque, in four steps so the colours stay few
        int tier = int(math.min(3, nz(volume[offset] / averageVolume[offset]) * 2))
        color zoneColor = color.new(
          close[offset] >= open[offset] ? color.teal : color.red, 85 - 20 * tier)
        zones.rect(
          chart.point.from_time(leftTime, high[offset]),
          chart.point.from_time(rightTime, low[offset]),
          zoneColor)
    zones.drawShapes()
The PineCanvas API at a glance
Sources hold the data, a Canvas styles and draws it. Every setter returns the Canvas, so calls chain.
Open a group to see its calls. The documentation covers each one in depth, and the same reference is kept as plain Markdown, ready to paste into an editor or an AI assistant.
Sources
valueField, paletteField, valueScroll, paletteScroll, push
- valueField(rows, columns, initial = na)
- A grid of numbers, coloured through the Canvas gradient. na cells are transparent.
- paletteField(rows, columns, initial = -1)
- A grid of exact palette indices. -1 is transparent, 0 is the first palette colour.
- valueScroll(rows, capacity) and paletteScroll(rows, capacity)
- Rolling sources that keep the newest columns, up to their capacity.
- push(column)
- Appends one column to a scroll, bottom row first, overwriting the oldest once full.
- get(row, column) and set(row, column, value)
- Read or write one cell. Row 0 is the bottom row unless invertRows() is set.
- fill(value)
- Writes one value into every cell.
- row(rowIndex)
- A writable array that shares one row's storage. Do not resize it.
- bandCount(), band(index), bandStart(index) and bandRows(index)
- Direct access to a field's storage blocks, for filling large images quickly.
Field stamps
rect, segment, circle
- rect(row0, column0, row1, column1, value, filled = true)
- A filled or outlined rectangle written into a field, clipped to its bounds.
- segment(row0, column0, row1, column1, value)
- A straight line of cells.
- circle(centerRow, centerColumn, radius, value, filled = false)
- A ring of cells, or a disc when filled.
Canvas
newCanvas, heatmap, palette, colorLevels, opacity, gamma
- newCanvas(colors = na)
- Full opacity and a fixed 0 to 1 value range. Exact colours for palette sources, gradient stops for value sources.
- heatmap(colors = na)
- A preset with 64 colour levels, automatic scaling and a 15 to 90 opacity ramp. Without colours it uses a thermal gradient.
- palette(colors)
- Replaces the palette or the gradient stops, with 2 to 100 entries.
- colorLevels(count)
- Samples a value source's gradient into 2 to 100 levels.
- opacity(lowOpacity, highOpacity = na)
- Opacity from the weakest level to the strongest, 0 to 100. One argument applies to every level.
- autoScale(mode = ScaleMode.wholeGrid)
- Normalizes over the whole grid, each column or each row.
- valueRange(minimum, maximum)
- A fixed value range, so the same colour means the same value between updates.
- gamma(value)
- The response curve. Below 1 lifts weak values, above 1 suppresses them.
- logarithmicY(enabled = true)
- Spaces rows logarithmically between positive price bounds.
- invertRows(enabled = true)
- Puts row 0 at the top.
- forceOverlay(enabled = true)
- Places the drawings on the main price chart.
- drawingLimit(count)
- Caps the polylines this Canvas may use, from 1 to 100.
- newStyle(...) and configure(style)
- Build a complete Style and apply it in one call.
- clear()
- Deletes the Canvas's drawings.
Drawing fields
drawLookback, draw, drawTime, drawGrid, drawTimeGrid
- drawLookback(source, lookback, bottom, top, rightOffset = 0)
- Places a field ending at the current bar. A lookback of 0 uses one bar per column.
- drawLookback(scroll, bottom, top, rightOffset = 0)
- Draws a rolling source at its current column count.
- draw(source, leftIndex, rightIndex, bottom, top)
- Places a field between two bar indices.
- drawTime(source, leftTime, rightTime, bottom, top)
- Places a field between two timestamps.
- drawGrid(source, columnEdges, rowEdges)
- Explicit bar-index and price edges, for an uneven grid.
- drawTimeGrid(source, timeEdges, rowEdges)
- Explicit timestamp and price edges.
Shapes
rect, triangle, circle, poly, drawShapes
- rect(topLeft, bottomRight, fillColor)
- Queues a rectangle from two chart.point.from_time() corners.
- triangle(cornerA, cornerB, cornerC, fillColor)
- Queues a triangle from three corners.
- circle(centre, radiusTime, radiusPrice, segments, fillColor)
- Queues an ellipse with separate time and price radii.
- poly(points, fillColor)
- Queues any closed polygon of 3 to 9,999 points.
- drawShapes()
- Draws the queue, replaces the last frame, empties the queue and returns the polylines used.
- clearShapes() and shapeCount()
- Discard or count what is queued.
- barsToTime(offsetBars)
- Estimates a timestamp from a bar offset on the current timeframe.
Inspection and helpers
drawingCount, componentCount, dimensions, scaledRange, gradient
- drawingCount()
- Polylines the Canvas currently owns.
- componentCount()
- Same-colour regions found by the last field render.
- dimensions()
- The last rendered field's rows and columns.
- scaledRange()
- The value range the last field render used.
- gradient(lowColor, highColor)
- A two-stop gradient.
- gradient(color0, color25, color50, color75, color100)
- A five-stop gradient.
Limits worth knowing before you build
PineCanvas reuses cached contour work and skips redrawing when the source, style and placement are unchanged. Large sources use tiled processing and storage bands to stay inside Pine's collection limits. TradingView's own limits still apply underneath.
Read the performance guide- Drawing budgets are shared
- Every Canvas in a script shares the 100 polyline limit with any other polylines. drawingLimit() caps one Canvas; it does not coordinate a global budget.
- Complexity sets the practical resolution
- More colours and more fragmented boundaries need more geometry. Memory and execution time remain limits even when the source fits in storage.
- Shapes are fills, not outlined objects
- A packed batch is grouped by colour. Same-colour overlaps form a union, and per-shape borders or layering are not part of the fill.
- Pick the right coordinates
- Bar-index drawings are bound to 10,000 bars back and 500 forward. Use time placement for farther history and real timestamps when candle alignment matters.
- Each Canvas owns its drawings
- Field and shape drawing replace the previous frame of that Canvas, so separate canvases are the way to build independent layers.
- The chart has its own behaviour
- Animation follows Pine executions, not a timer, and chart anti-aliasing can show thin seams between adjacent fills at some zoom levels.
Common questions about PineCanvas
Short answers for anyone deciding whether PineCanvas fits their script. The documentation goes deeper, and the TradingView publication carries the source.
What is PineCanvas?
PineCanvas is an open-source graphics engine for TradingView, published as a Pine Script v6 library. It draws heatmaps, detailed images, rasterized 3D frames and large batches of filled shapes by tracing same-colour regions and packing them into shared polylines, so an indicator is no longer limited to one drawing per cell.
How do I use PineCanvas in a Pine Script indicator?
Add import Alien_Algorithms/PineCanvas/1 as pc to a version 6 indicator declared with max_polylines_count = 100. Create a source such as pc.paletteField() or pc.valueField(), create a Canvas with pc.newCanvas() or pc.heatmap(), write your cells, then call a draw method such as drawLookback() on the last bar. The TradingView publication shows the latest version number to import.
How many cells can one TradingView indicator draw with PineCanvas?
Around 1.1 million cells in one image is attainable. The published Julia fractal is 1344 × 804 cells, which is 1,080,576. The practical limit depends on boundary complexity, colour distribution, memory and execution time, so smooth or sparse images can go higher and highly fragmented ones can be demanding at smaller sizes.
How does PineCanvas work within the 500 box and 100 polyline limits?
It does not raise the limits, it spends them differently. Instead of one box per cell, PineCanvas traces each same-colour region, discards the internal edges and joins separate regions with zero-width links, so the regions of one colour share polylines of up to 10,000 points each. A solid block of thousands of cells costs four corners, and transparent cells cost nothing.
How do I draw a heatmap in Pine Script?
Write your values into a ValueField, or push one column per bar into a ValueScroll. Create a Canvas with pc.heatmap(), set colorLevels(), opacity() and gamma(), then call drawLookback() with the bottom and top price. PineCanvas maps each value to a colour level and places the grid at real price levels.
Can PineCanvas render Pine3D scenes?
Yes. The rasterize() call in Pine3D writes a 3D scene into a PaletteField and returns its palette, and PineCanvas draws that field on the chart. The published demo is a 1536 × 960 scene with depth-tested visibility, smooth shading and cast shadows.
Can it draw shapes that are not on a grid?
Yes. The Shape API queues rectangles, triangles, ellipses and custom polygons in chart time and price, and drawShapes() packs every shape of one colour into shared polylines. One polyline holds about 1,600 four-corner rectangles, and a batch accepts up to 100,000 source vertices.
Can PineCanvas animate or update in real time?
A Canvas redraws whenever the script runs, so a picture can change on every new bar or tick. Animation follows Pine executions, not a timer. When the source, style and placement are unchanged, PineCanvas reuses its cached contours and skips the redraw.
Is PineCanvas free to use?
Yes, for non-commercial use. PineCanvas is published open source on TradingView under CC BY-NC-SA 4.0, which asks that Alien_Algorithms is credited for the underlying software. Commercial use needs a licence from Alien_Algorithms.
Put more on the chart
PineCanvas makes detailed visualizations practical inside Pine Script's drawing limits. Import it, hand it a field or a queue of shapes, and decide what belongs on the chart.
Licensed under CC BY-NC-SA 4.0: free for non-commercial use when Alien_Algorithms is credited for the underlying software. For commercial licensing, contact Alien_Algorithms on TradingView.